Visualizing Steak preferences of Select Americans

Intro & Background

The data used for this project were downloaded from FiveThirtyEight - steak-survey. They were originally used in the article: How Americans Like Their Steak. The goal of this part of the project will be to recreate the data used in this article.

Data

The data gets read in using the function read.csv and looked at using the glimpse function from the dplyr package.

## read in the data
steak <- read.csv("/cloud/project/data/steak-risk-survey.csv")
## Include code here to explore the data
glimpse(steak)
## Observations: 551
## Variables: 15
## $ RespondentID                                                                                                                                                                                                                                                                      <dbl> ...
## $ Consider.the.following.hypothetical.situations...br.In.Lottery.A..you.have.a.50..chance.of.success..with.a.payout.of..100...br.In.Lottery.B..you.have.a.90..chance.of.success..with.a.payout.of..20...br..br.Assuming.you.have..10.to.bet..would.you.play.Lottery.A.or.Lottery.B. <fct> ...
## $ Do.you.ever.smoke.cigarettes.                                                                                                                                                                                                                                                     <fct> ...
## $ Do.you.ever.drink.alcohol.                                                                                                                                                                                                                                                        <fct> ...
## $ Do.you.ever.gamble.                                                                                                                                                                                                                                                               <fct> ...
## $ Have.you.ever.been.skydiving.                                                                                                                                                                                                                                                     <fct> ...
## $ Do.you.ever.drive.above.the.speed.limit.                                                                                                                                                                                                                                          <fct> ...
## $ Have.you.ever.cheated.on.your.significant.other.                                                                                                                                                                                                                                  <fct> ...
## $ Do.you.eat.steak.                                                                                                                                                                                                                                                                 <fct> ...
## $ How.do.you.like.your.steak.prepared.                                                                                                                                                                                                                                              <fct> ...
## $ Gender                                                                                                                                                                                                                                                                            <fct> ...
## $ Age                                                                                                                                                                                                                                                                               <fct> ...
## $ Household.Income                                                                                                                                                                                                                                                                  <fct> ...
## $ Education                                                                                                                                                                                                                                                                         <fct> ...
## $ Location..Census.Region.                                                                                                                                                                                                                                                          <fct> ...

I added the extra code needed to be able to generate a plot.

pref <- steak %>% 
  mutate(steak_pref =  factor(How.do.you.like.your.steak.prepared.,
                             levels = c("Well",
                                        "Medium Well",
                                        "Medium",
                                        "Medium rare",
                                        "Rare"))) %>% 
  filter(steak_pref != "") %>% 
  group_by(steak_pref) %>% 
  summarise(n = n()) %>%
  mutate(prop = n / sum(n))

Plots

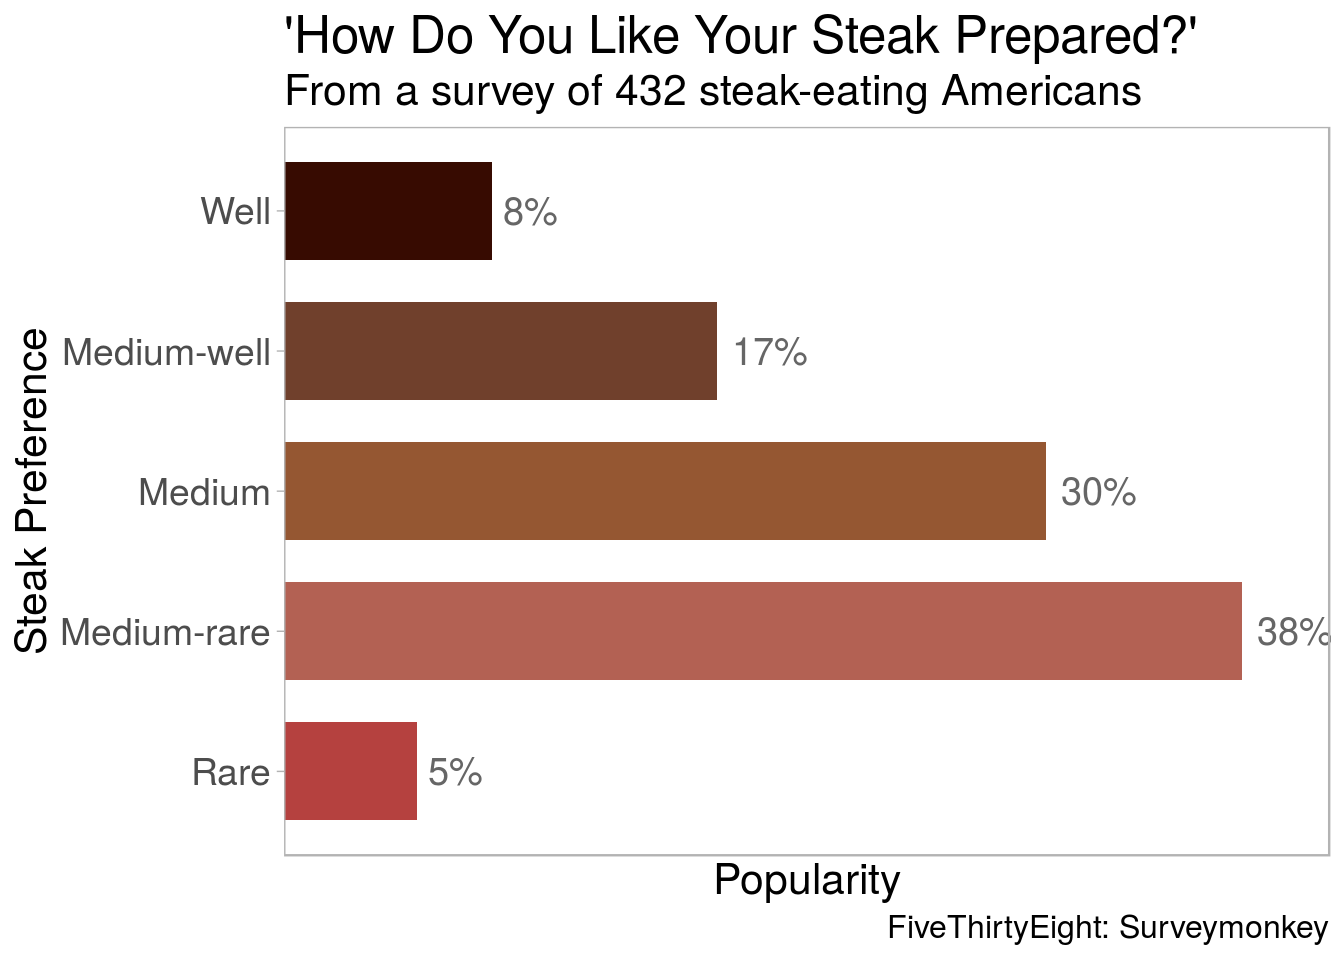
Barplot created showing the steak preferences of people included in the survey.

ggplot(pref) +
  geom_bar(aes(x = steak_pref, y = prop, fill = steak_pref),
                stat = 'identity', 
                width = 0.7) +
  geom_text(aes(label = paste0(as.integer(prop*100),"%"),
                x = steak_pref,
                y = prop), 
            stat= "identity", 
            hjust = -0.2, 
            size = 5,
            color = "grey40") +
  coord_flip() +
  scale_fill_manual(values = c("#370B01", 
                           "#70402C",
                           "#955732", 
                           "#B36153",
                           "#B5413F")) +
  scale_x_discrete(limits = levels(fct_rev(pref$steak_pref)),
                labels = c("Well", 
                           "Medium Well" = "Medium-well",
                           "Medium",
                           "Medium rare"="Medium-rare",
                           "Rare")) +
  scale_y_discrete(labels = scales::percent, 
                expand = c(mult = c(0,0), 
                           add = c(0,0.035))) +
  labs(title="'How Do You Like Your Steak Prepared?'", 
                subtitle="From a survey of 432 steak-eating Americans",
                caption="FiveThirtyEight: Surveymonkey") +
  theme_light() +
  theme(axis.text = element_text(size = 14), 
                title = element_text(size = 16), 
                legend.position="none", 
                plot.caption=element_text(size = 12), 
                panel.grid.major = element_blank(), 
                panel.grid.minor = element_blank(),
                axis.text.x = element_blank() 
  ) +
  xlab("Steak Preference") +
  ylab("Popularity")